
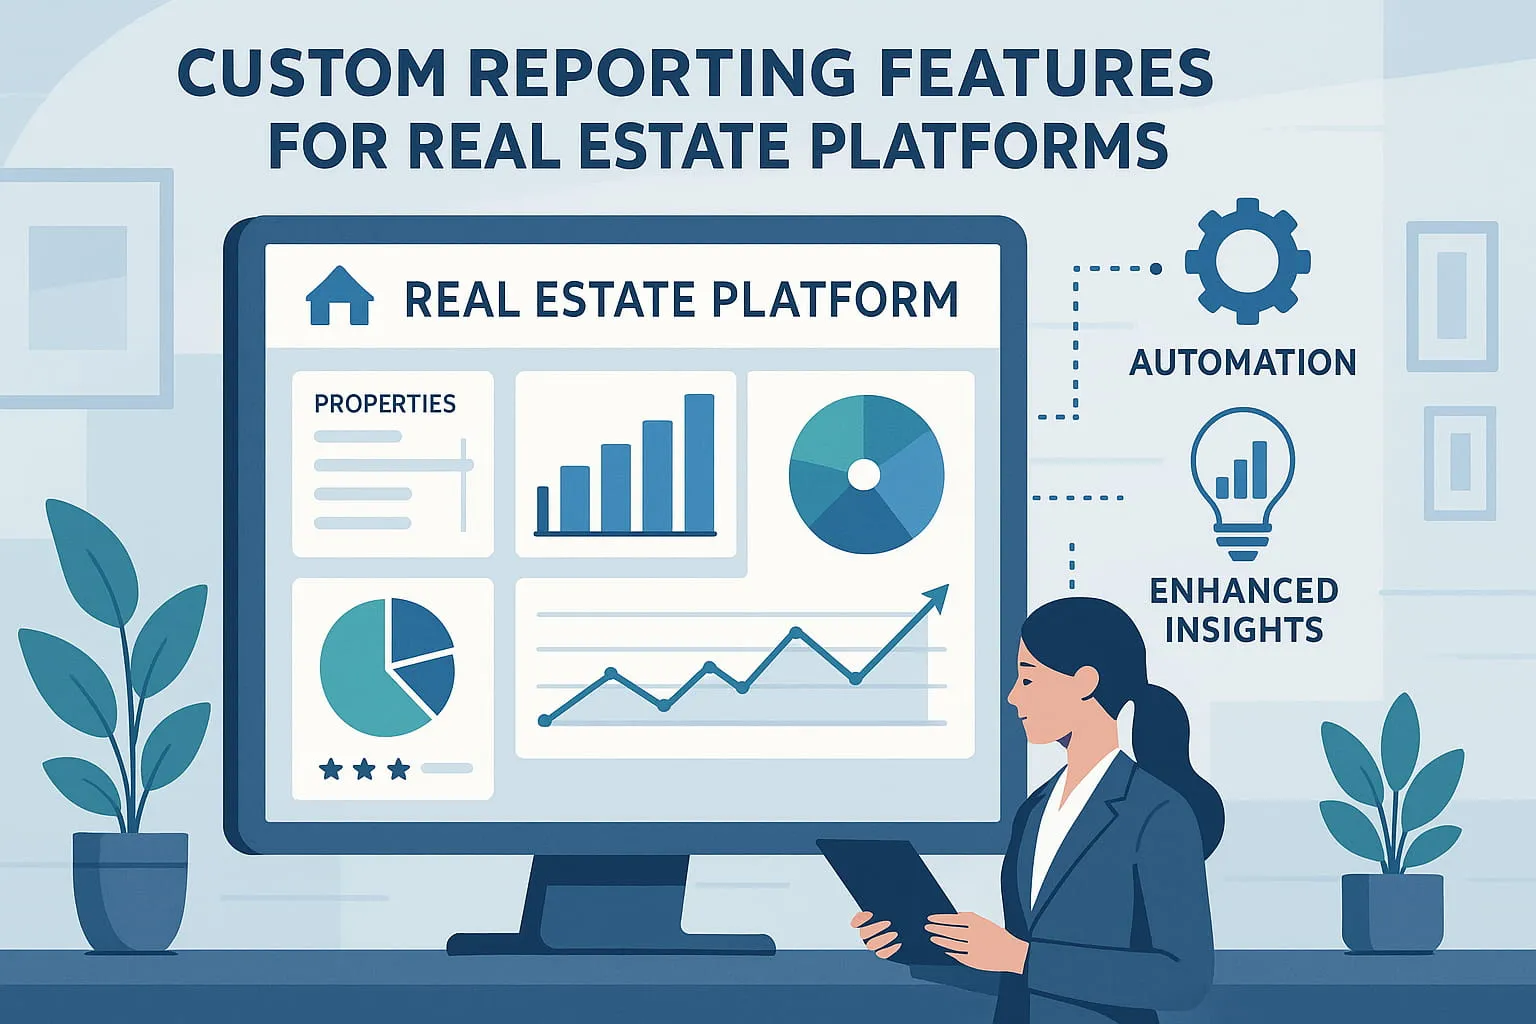
Custom reporting tools are transforming real estate. They save time, automate processes, and provide detailed insights for better decision-making. Here’s why they matter:
- Save Time: Automate manual tasks like financial tracking, tax reporting, and occupancy monitoring.
- Boost Efficiency: Reduce errors and improve workflows with tools like predictive maintenance and utility tracking.
- Improve Insights: Track key metrics like Net Operating Income (NOI), occupancy rates, and market trends for smarter strategies.
- Stay Competitive: Use market analysis tools to set competitive rent prices and spot investment opportunities.
- Ensure Compliance: Simplify tax reporting and regulation tracking to avoid costly penalties.
For example, Midwest Property Management saved over 100 hours annually by adopting automated reporting. Tools like these not only streamline operations but also help property managers meet growing demands for detailed, tailored reports.
How Canopy Analytics is Disrupting Multifamily Real Estate w/ AI Data Insights
Financial Reporting Tools
Financial reporting tools are essential for real estate platforms, enabling property managers and investors to make informed, data-driven decisions. A study by US Bank reveals that 82% of businesses fail due to poor cash flow management. This highlights the importance of having reliable financial tools to maintain stability and growth.
Cash Flow Management
Modern real estate platforms simplify cash flow management by automating income and expense tracking. These tools categorize transactions automatically and produce detailed reports, saving significant time. Kristin Mase, Senior Vice President at Jamestown Properties, emphasizes the impact of such systems:
“MRI’s flexible reporting and processes allow different departments across our organization to use the software in the way that works best for them. Our budgeting process is more efficient, and MRI has evolved as we have evolved.”
Key financial metrics integrated into these platforms include:
| Metric Type | Purpose | Target Benchmark |
|---|---|---|
| Net Operating Income (NOI) | Measures property’s profitability | Positive trend quarter-over-quarter |
| Cash-on-Cash Return | Evaluates investment efficiency | Above 8% considered strong |
| Operating Expense Ratio | Tracks cost efficiency | Industry-specific baseline |
| Debt Service Coverage | Assesses debt management | Above 1.25 recommended |
These metrics provide a clear snapshot of financial health, helping stakeholders make better decisions.
Tax Reporting
Tax reporting tools have advanced significantly, reducing the risk of costly errors. Considering that 40% of small businesses face penalties due to tax mistakes, automation in tax management has become indispensable. These tools assist with:
- Tracking property depreciation schedules
- Categorizing income and expenses
- Ensuring IRS compliance
- Managing real and personal property tax obligations
Nicole Warwood, CFO, highlights the benefits of such systems:
“Agora is a game-changer, reducing my reporting tasks and giving investors instant access to their details – no calls or emails needed. It’s made life easier for everyone.”
By automating complex tax requirements, these tools minimize errors and streamline financial processes.
Investment Performance Metrics
Investment performance tools provide insights into portfolio health, helping property managers and investors evaluate profitability. For example, an ROI exceeding 8-10% is typically considered a strong indicator of success. Commonly tracked metrics include:
- Internal Rate of Return (IRR)
- Capitalization Rate (Cap Rate)
- Gross Rent Multiplier (GRM)
- Equity-to-Value Ratio
These tools not only track performance but also automate tasks like data validation, report generation, and performance monitoring across multiple properties. In fact, they can save property managers up to 80 hours of accounting work annually, allowing them to focus on strategic planning and growth.
Property Management Analytics
Property management analytics tools have transformed the way real estate professionals monitor and improve their operations. By enabling data-driven decisions across multiple properties, these tools help cut costs and boost tenant satisfaction. Let’s break down how occupancy tracking, maintenance analytics, and utility reports each play a role in this process.
Occupancy Tracking
Automated reporting has made occupancy tracking a game-changer for property managers aiming to keep vacancy rates low and rental income high. While the national average occupancy rate sits at around 92%, the best-performing property management companies achieve rates between 95% and 97%. To put this into perspective, for a 50-unit portfolio with an average monthly rent of $1,500, just a 4% higher vacancy rate could mean losing over $36,000 in annual revenue.
Michel Lautensack, a Fractional CFO with years of property management experience, highlights its importance:
“As a fractional CFO who’s specialized in property management finances for decades, I’ve seen firsthand how implementing robust occupancy tracking systems transforms struggling operations into profit-generating machines.”
Here are some key metrics property managers should focus on:
| Metric | Purpose | Industry Benchmark |
|---|---|---|
| Physical Occupancy | Tracks currently occupied units | 95–97% for top performers |
| Days on Market | Measures time to lease vacancies | Less than 30 days |
| Pre-leased Units | Tracks units rented in advance | 17.2% of vacant units |
Maintenance Analytics
Maintenance analytics is another area where technology has made huge strides. By using IoT devices, real-time monitoring, and AI diagnostics, property managers can extend the life of building systems by up to 40%. This proactive approach prevents costly repairs and optimizes maintenance schedules.
The benefits are tangible:
- Faster response times improve tenant satisfaction by 30%.
- Automated systems save over 20 hours per listing.
- Timely maintenance boosts lease renewals by 30%.
For example, AvalonBay Communities adopted predictive analytics across their properties in 2022. By analyzing market trends and property details in real time, they increased revenue by 4.7% without significantly impacting occupancy rates.
Utility Usage Reports
Utility expenses can account for 10% to 30% of a building’s operating budget, so effective monitoring is essential. Advanced utility tracking systems offer powerful insights through:
- Real-time Monitoring: Smart meters and IoT sensors provide instant alerts for unusual consumption patterns or potential equipment failures.
- Cost Allocation Systems: Tools like Ratio Utility Billing Systems (RUBS) ensure fair cost distribution based on factors such as square footage or occupancy levels.
- Efficiency Analytics: By analyzing data for seasonal trends and inefficiencies, property managers can identify upgrades and implement conservation strategies, such as programmable thermostats, regular audits, and tenant education.
This approach not only lowers costs but also promotes greener practices, making it a win-win for property managers and tenants alike.
Market Analysis Tools
Market analysis tools have revolutionized the way real estate professionals assess properties and make smart decisions. These tools provide a competitive edge by combining financial insights with external market perspectives, helping users evaluate properties more effectively.
Market Comparison Tools
Contemporary Comparative Market Analysis (CMA) tools are designed to deliver highly accurate property valuations. They take into account multiple factors simultaneously, ensuring precise market value estimates. A typical CMA report is packed with information, often spanning 30–50 pages, and includes data, charts, and photos to provide a comprehensive overview.
Victoria Araj, Team Leader at Rocket Mortgage, explains:
“A CMA is a tool real estate agents use to estimate the value of a specific property by evaluating similar ones that have recently sold in the same area.”
When using CMA tools, focusing on specific comparison factors can improve accuracy:
| Comparison Factor | Recommended Parameters | Impact on Valuation |
|---|---|---|
| Location Proximity | Same neighborhood or subdivision | Primary influence |
| Sale Timeline | Within the past 3–6 months | Critical for accuracy |
| Property Count | 5–10 comparable properties | Enhances reliability |
Rent Price Analysis
Rental price analysis tools are invaluable for setting competitive rent rates. These systems use real-time market data to recommend pricing strategies tailored to current conditions.
The benefits of these tools are clear:
- Processing Large Data Sets
Tools like Rentometer analyze around 10 million new rental records annually, providing a wealth of data for informed pricing. - Seasonal Adjustments
Advanced systems consider seasonal trends, which can be especially important during peak rental periods like spring and summer. - Economic Insights
By factoring in wage growth and local economic trends, these tools help landlords and property managers develop pricing strategies that align with market realities.
Regulation Monitoring
For property managers dealing with multiple jurisdictions, staying compliant with regulations is a critical task. Regulatory compliance tools simplify this process by tracking changes in local, state, and federal laws, including fair housing regulations, zoning ordinances, and environmental standards. These tools provide timely updates and maintain up-to-date documentation, safeguarding property managers from costly legal issues. This level of monitoring is especially crucial in a market as large as the $348 billion commercial real estate sector in 2023.
sbb-itb-7432820
Data Visualization Tools
Modern real estate platforms now use advanced visualization tools to turn complex data into actionable insights. These tools are invaluable for helping stakeholders make better decisions. Let’s dive into some key visualization techniques: property heat maps for market analysis, risk assessment charts for identifying potential challenges, and scenario planning tools to predict future market conditions.
Property Heat Maps
Property heat maps are among the most impactful visualization tools. They overlay critical data onto geographic maps, making it easier to spot promising investment opportunities at a glance. For instance, investors who used market heat maps reported an average ROI of 31%, compared to just 19% for those who didn’t.
A notable example comes from King County, Washington, where a Health and Housing Data Dashboard integrates demographic data with health outcomes for public housing residents. This tool allows users to filter information across various neighborhoods and public housing agency sites, offering valuable insights for property development.
| Heat Map Layer | Key Metrics | Business Impact |
|---|---|---|
| Market Activity | Sales volume, price trends | Identifies emerging markets |
| Demographics | Income levels, population density | Targets ideal tenant profiles |
| Infrastructure | Schools, transit, amenities | Assesses location value |
Risk Assessment Charts
Risk assessment charts complement heat maps by highlighting potential challenges. For example, Santa Ana, California, uses a Homeless Services Data Dashboard to map risk factors, enabling more informed decision-making. These charts offer a clear view of risks, helping stakeholders address issues proactively.
Scenario Planning Tools
Scenario planning tools take things a step further by modeling different market conditions and their potential impacts. In Fort Collins, Colorado, a housing dashboard tracks progress toward the city’s 2021 Housing Strategic Plan. It presents various market scenarios, helping planners make data-backed decisions.
The success of these tools often depends on thoughtful design. As UX Design World explains:
“Effective dashboards should not only present data but also convey the story behind it, guiding users toward making informed decisions without overwhelming them with details.”
System Requirements
These technical specifications ensure that custom reporting tools function efficiently and securely across platforms, supporting the advanced analytics discussed earlier.
Integration Options
Real estate platforms need to integrate effortlessly with essential services. For instance, Loft47 connects with Xero, DocuSign, and Dotloop to sync commission data across CRM, transaction, and accounting systems.
| Integration Type | Partners | Function |
|---|---|---|
| Financial | Xero, QuickBooks | Commission tracking, expense management |
| Document Processing | Ascendix IDP, DocuSign | Automated data extraction, e-signatures |
| Property Data | Zillow, MLS Systems | Real-time market data, listing sync |
| Lead Management | Zurple, CRM Systems | Behavioral analysis, communication automation |
“We are all about the integration, working with other products that are amazing at what they do rather than try and build everything ourselves.” – Tracy Simmons, CRO, LOFT47
Beyond smooth integrations, strong security measures are essential to safeguard sensitive information.
Security Standards
Effective security is non-negotiable, especially considering that real estate businesses suffered over $396 million in losses from email compromise scams in 2022.
Key Data Protection Measures:
- SOC 2 compliance
- End-to-end encryption
- Multi-factor authentication, which prevents 99.9% of compromises
- Routine security audits
- Compliance with GDPR and HIPAA regulations, where applicable
Audit Trail Capabilities:
- Comprehensive system logs
- Timestamped user activity tracking
- Document version control
- Access monitoring
While security measures protect data, ensuring mobile-friendly functionality is equally crucial for a well-rounded reporting system.
Mobile Access
With mobile devices accounting for 52% of global web traffic, real estate reporting tools must offer a seamless mobile experience without compromising security or performance.
Essential mobile features include:
- Responsive design with offline data access
- Real-time synchronization
- Compressed data transfer for faster performance
- Secure authentication methods
Optimizing queries can also cut load times by up to 80%.
Summary
Modern real estate platforms are increasingly leaning on custom reporting to stay ahead, with 68% of property management companies now using specialized software to streamline their operations. These tools transform complex data into straightforward metrics spanning finance, operations, and market trends.
The benefits are clear: better financial analytics, smoother property management, and sharper market insights are driving measurable improvements. Efficiency gains are particularly impactful in real estate, where responding quickly to market changes is crucial.
| Reporting Category | Key Benefits | Impact |
|---|---|---|
| Financial Analytics | Real-time cash flow tracking | Automated commission calculations reduce manual workloads |
| Property Management | Optimized preventive maintenance | Lower emergency repair expenses |
| Market Analysis | Early trend detection | Improved pricing strategies |
| Data Visualization | Identifying patterns with ease | Infographics are 30x more engaging than text-heavy reports |
Advanced algorithms are also making a difference by monitoring building systems to prevent emergency repairs and boost operational efficiency. This tech-driven approach is reshaping property management, making it more proactive and efficient.
Looking ahead, the future of reporting lies in blending automation with personalized insights. Platforms need to combine strong security, mobile-friendly access, and customized dashboards to deliver critical metrics effectively. Xenia Tech is already embracing these trends, offering tailored solutions that equip real estate teams with the insights they need to make confident decisions.
FAQs
How can custom reporting tools enhance financial stability for real estate platforms?
Custom reporting tools are a game-changer for real estate platforms looking to maintain strong financial stability. They provide precise, actionable insights into essential financial metrics, making it easier for property managers to stay on top of cash flow, occupancy rates, and profitability – all in real-time.
What makes these tools so effective is their ability to generate tailored reports that spotlight important financial trends. This helps property managers make smarter decisions and plan strategically. Beyond that, they dig into spending patterns and resource usage, revealing inefficiencies and potential cost-saving opportunities. The result? Smoother daily operations and a stronger foundation for long-term financial success, as risks are minimized and resources are managed wisely.
What are the key advantages of using occupancy tracking and maintenance analytics for property managers?
Using occupancy tracking and maintenance analytics can transform the way property managers handle their responsibilities. By diving into occupancy data, managers can make smarter decisions about space usage, allocate resources more effectively, and fine-tune marketing efforts to attract the right tenants. This means properties can operate more efficiently while appealing to the ideal audience.
On the other hand, maintenance analytics helps spot potential problems before they turn into costly headaches. With a predictive maintenance approach, managers can address issues early, cutting down on expensive repairs and avoiding disruptions. This not only saves money but also keeps tenants happy by maintaining a comfortable and functional living space. Together, these tools simplify operations, support better decision-making, and elevate the overall experience for both tenants and property managers.
How do market analysis tools help real estate professionals set competitive rental prices and find profitable investment opportunities?
Market analysis tools give real estate professionals the insights they need to set competitive rental prices and identify profitable investment opportunities. By diving into data like current rental rates, occupancy patterns, and local demographics, these tools help ensure pricing aligns with what the market demands.
They also pinpoint high-growth areas by monitoring factors such as population growth, new infrastructure projects, and economic changes. With this data-driven approach, professionals can make smarter decisions, boost rental income, and focus on properties with strong potential for future value increases.